Hanwha Q CELLS Co., Ltd. today reported its unaudited financial results for the second quarter of 2016.
Second Quarter 2016 Highlights
- Net revenues were $638.0 million, compared with $514.9 million in the first quarter of 2016 and $338.0 million in the second quarter of 2015.
- Gross profit was $151.2 million, compared with $109.0 million in the first quarter of 2016 and $58.4 million in the second quarter of 2015.
- Gross margin was 23.7%, compared with 21.2% in the first quarter of 2016 and 17.3% in the second quarter of 2015.
- Operating income was $84.5 million, compared with $56.7 million in the first quarter of 2016 and $1.0 million in the second quarter of 2015.
- Net income attributable to Company's ordinary shareholders was $76.8 million, compared with a net income of $27.5 million in the first quarter of 2016 and a net loss of $14.2 million in the second quarter of 2015.
- Earnings per fully diluted American Depositary Share ("ADS" and each ADS represents 50 of the Company's ordinary shares) were $0.92, compared with earnings per fully diluted ADS of $0.33 in the first quarter of 2016 and a net loss per fully diluted ADS of $0.17 in the second quarter of 2015.
Mr. Seong-woo Nam, Chairman and CEO of Hanwha Q CELLS, remarked, "We are pleased to report a solid quarterly execution which exceeded our financial targets driven by disciplined, yet flexible global operations, while adopting into continuously changing market environments cost effectively."
"We continue to improve our financial positions and cash management to support our growing business rationally," Mr. Nam emphasized. "This year we are maintaining net debt to equity ratio below 250% level and our cash conversion cycle has fallen below 60 days compared with over 100 days a year ago."
Mr. Nam concluded by noting, "Despite highly cyclical and dynamic nature of our industry, we remain optimistic about long term growth prospects in our industry as solar power will have much higher penetration in global energy mix, and we are focused to expand our competitive advantage delivering sustainable growth as a prominent solar technology leader."
Second Quarter 2016 Results
Net Revenues
- Total net revenues were $638.0 million, up 23.9% from $514.9 million in the first quarter of 2016 and up 88.8% from $338 million in the second quarter of 2015.
Gross Profit and Margin
- Gross profit in the second quarter of 2016 was $151.2 million, compared with $109.0 million in the first quarter of 2016 and $58.4 million in the second quarter of 2015.
- Gross margin in the second quarter of 2016 was 23.7%, compared with 21.2% in the first quarter of 2016 and 17.3% in the second quarter of 2015.
Operating Expense, Income and Margin
- Total operating expenses were $66.7 million in the second quarter of 2016, up 27.5% from $52.3 million in the first quarter of 2016 and up16.2% from $57.4 million in the second quarter of 2015. Total operating expenses as a percentage of revenues were largely unchanged at 10.5% in the second quarter of 2016 compared with 10.2% in the first quarter of 2016 and substantially lower compared with 17.0% in the second quarter of 2015.
- Selling and marketing expenses were $33.1 million in the second quarter of 2016, up 45.2% from $22.8 million in the first quarter of 2016 and up 67.2% from $19.8 million in the second quarter of 2015.
- General and administrative expenses were $19.6 million in the second quarter of 2016, up 9.5% from $17.9 million in the first quarter of 2016 and down 23.7% from $25.7 million in the second quarter of 2015.
- Research and development expenses were $14.0 million in the second quarter of 2016, up 20.7% from $11.6 million in the first quarter of 2016 and up 17.6% from $11.9 million in the second quarter of 2015.
Net Interest Expense
- Net interest expense was $9.3 million in the second quarter of 2016, compared with $12.8 million in the first quarter of 2016 and $14.8 million in the second quarter of 2015.
- Interest coverage ratio was 7.7x in the second quarter of 2016, compared with 3.6x in the first quarter of 2016 and 0.1x in the second quarter of 2015.
Foreign Currency Exchange Gain (Loss)
- Net foreign currency exchange gain was $1.8 million in the second quarter of 2016, compared with a net gain of $4.0 million in the first quarter of 2016.
Changes in Fair Value of Derivative Contracts
- The Company recorded a net loss of $13.7 million in the second quarter of 2016 from the change in fair value of derivatives in hedging activities, compared with a net loss of $15.3 million in the first quarter of 2016 and a net gain of $1.2 million in the second quarter of 2015.
Income Tax Expense (Benefit)
- Income tax benefit was $8.8 million in the second quarter of 2016, compared with an income tax expense of $4.6 million in the first quarter of 2016 and an income tax expense of and $0.8 million in the second quarter of 2015.
Net Income (Loss) and Earnings (Loss) per ADS
- Net income attributable to Company's ordinary shareholders was $76.8 million in the second quarter of 2016, compared with a net income of $27.5 million in the first quarter of 2016 and a net loss of $14.2 million in the second quarter of 2015.
- Earnings per fully diluted ADS on a GAAP basis was $[0.92] in the second quarter of 2016, compared with earnings per fully diluted ADS of $0.33 in the first quarter of 2016 and a net loss per fully diluted ADS of $0.17 in the second quarter of 2015.
Financial Positions
As of June 30, 2016, the Company had cash and cash equivalents of $255.4 million, compared with $327.3 million as of March 31, 2016. The restricted cash as of June 30, 2016 was $165.2 million, compared with $158.6 million in the previous quarter.
Total short-term bank borrowings (including the current portion of long-term bank borrowings) were $379.7 million as of June 30, 2016, a decrease of $71.0 million from the first quarter of 2016. As of June 30, 2016, the Company had total long-term debt (net of current portion and long-term notes) of $799.6 million, an increase of $151.6 million from the first quarter of 2016. The Company's long-term bank and government borrowings are to be repaid in installments until their maturities, which range from one to sixteen years.
Net cash used in operating activities was $72.8 million in the second quarter of 2016. As of June 30, 2016, accounts receivable was $518.3 million. Days sales outstanding ("DSO") was 71 days in the second quarter of 2016. As of June 30, 2016, inventories totaled $485.3 million. Days inventory turn was 89 days in the second quarter of 2016.
Capital expenditures were $36.5 million in the second quarter of 2016.
Operation Updates and Business Outlook
Capacity Status
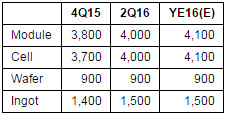
As of June 30, 2016, the Company had annualized production capacities of 1,500MW for ingot, 900MW for wafer, 4,000MW for cell and 4,000MW for module.
- Manufacturing Capacity (in nameplate MW)
Business Outlook
For the full year 2016, the Company expects:
- Total module shipments of 4,800 to 5,000MW
- Capital expenditures of approximately $180 million, of which $100 million for capacity expansion and the remaining $80 million for manufacturing technology upgrades and certain R&D related expenditures